Loss limit · Stop rule
Set yourself an annual loss limit: when to stop, how long for, and what to review
Asking "how much loss is too much" only once the loss already hurts means missing the moment when the decision is easiest to make. This piece is about writing the stopping conditions down in advance: the most you will lose in a year, why it belongs on paper as an amount rather than a percentage, what to do with the time after you hit it, and how to recalculate for the year after. The numbers are all examples; the method is the point.
A per-trade stop and a yearly line are not doing the same job. The stop governs one trade; the yearly loss limit governs a whole year. There are only three moving parts to using it — write it down as a specific amount, stop opening new positions once the year's losses reach it, and spend the time after that reviewing rather than trading.
The numbers are yours to fill in. The 10,000 USDT of capital, the 20% annual ceiling and the one-month pause used throughout this piece are illustrative parameters, picked so the arithmetic reads clearly, not recommended values. What goes in their place is your own money — money you could lose without it changing your life — and a percentage you can actually live with.
One more thing up front: this is a rule I use myself. It is not an industry standard and it is not any institution's requirement. I am not a licensed adviser; what follows is personal experience and a few pieces of arithmetic.
Why add a yearly line when you already have a per-trade stop
Our piece on position sizing: letting a single trade lose at most 1% of your account is about the per-trade line: whichever trade turns out wrong and hits its stop, the loss is still only 1% of the account. That line works well, but it only governs one trade. It guarantees that each mistake costs you a little. It says nothing about how many mistakes you get to make in a year.
Put the numbers on the table and it is obvious. Account of 10,000 USDT, 1% risk per trade, so at most 100 USDT per trade. If the ceiling you set for the year is 2,000 USDT, then 2,000 ÷ 100 = 20 — twenty losers in a row before you touch the line. Push per-trade risk to 2% and each trade is 200 USDT, 2,000 ÷ 200 = 10, ten trades and you are there. This is division, not probability. It does not predict whether you will lose twenty in a row; it only tells you that on the day the losses really do add up to that number, the line is sitting right there.
The two lines answer two different questions. The per-trade line answers "how much can this one trade cost me." The yearly line answers "how much can this whole business charge me in tuition this year." Answer the first and the second can still be a bottomless pit: you can stop out politely on every single trade and still grind a large piece of the account away over a year, because nobody ever called time. The yearly line is the person calling time.
How to set it: work it out as an amount, then write it down
The method in one sentence: take the money you can afford to lose and multiply it by a percentage. The illustrative parameters here are 20% of 10,000 USDT — 10,000 × 20% = 2,000 USDT, the most you will lose this year. There is nothing authoritative about that 20%. It is simply a value I picked so the arithmetic reads clearly; swap in 10% or 30% and the method is identical.
The step that matters is the last one: write the result as an amount, do not stop at a percentage. "I will lose at most a fifth this year" sounds like an attitude, and an attitude is easy to talk yourself out of. "I will lose at most 2,000 USDT this year" is a number you can reconcile against. When the running total reaches 1,800, you know 200 is left, and that number answers the question of whether to open the next trade. A percentage never does; it always manages to look like there is room.
Where do you write it? On the first page of the journal from how to keep a position journal and review yourself: the capital you started the year with, the year's limit as an amount, and the per-trade limit as an amount, three numbers side by side. After that, every time you close a losing position you log it and add it to the running total. Not logging it is the same as not having the line — when I estimate from memory, the number I come up with is always smaller than the one in the records.
There is one convention you have to settle for yourself: whether the running total counts only realised losses, or unrealised ones too. I count the former, closed positions only, and track unrealised losses in a separate column. Fold unrealised losses in and a single choppy stretch trips the line, which makes it unenforceable. But that is a choice, not a rule; managing both together is perfectly defensible, as long as you do not switch conventions halfway through the year.
What to do once you hit it: it is new positions that stop
First, stopping is not liquidating. What happens to the positions you are already holding on the day you hit the line is a separate decision, and it should not be made on the impulse of "I have just hit my limit." My rule is: stop opening new positions; existing positions carry on under the stops and the plan you set for them at the time. A position deserves to be closed when its own reason arrives, not because the account touched a line. Making another big move at your worst moment is rarely a good move.
How long? The minimum I set for myself is a month. That is an illustrative parameter too — long enough for the impulse to cool, not so long that it looks like quitting. The month is a cooling-off period for reviewing, not a countdown: when it ends I still do not open anything new that year; new positions wait for the next year, after I have recalculated on the reduced capital. Two weeks or a quarter, pick whatever length you can actually hold to, and write it in the journal.
Three things to do with that time. First, read the journal from the beginning. Not hunting for "which trade lost the most" but for "which trades had the same reasoning behind them" — the reason that keeps recurring is the thing this year actually bought you. Second, recalculate the per-trade line on what is left. The capital changed, so the amount 1% corresponds to changed too; skip this and you restart measuring with last year's yardstick. Third, get the market out of your line of sight. Turn off notifications, move the app off your home screen, whatever works — the point is that the month is genuinely a pause, not "not trading, but staring at charts and regretting things daily."
Those three are homework I set for myself; adjust them to your own situation. Only one thing should not bend: do not let the pause turn into the same hunt for an entry, just from a different chair.
Why stopping, rather than trading your way back
Because losses and recovery are not symmetrical, and the deeper the hole, the steeper the slope. Gain required = loss ÷ (100 − loss), read as a percentage — arithmetic you can check on a calculator: down 20% needs 20 ÷ 80 = 25% to get back; down 30% needs 30 ÷ 70 ≈ 42.9%; down 40% needs 40 ÷ 60 ≈ 66.7%; down 50% needs 50 ÷ 50 = 100%, a double.
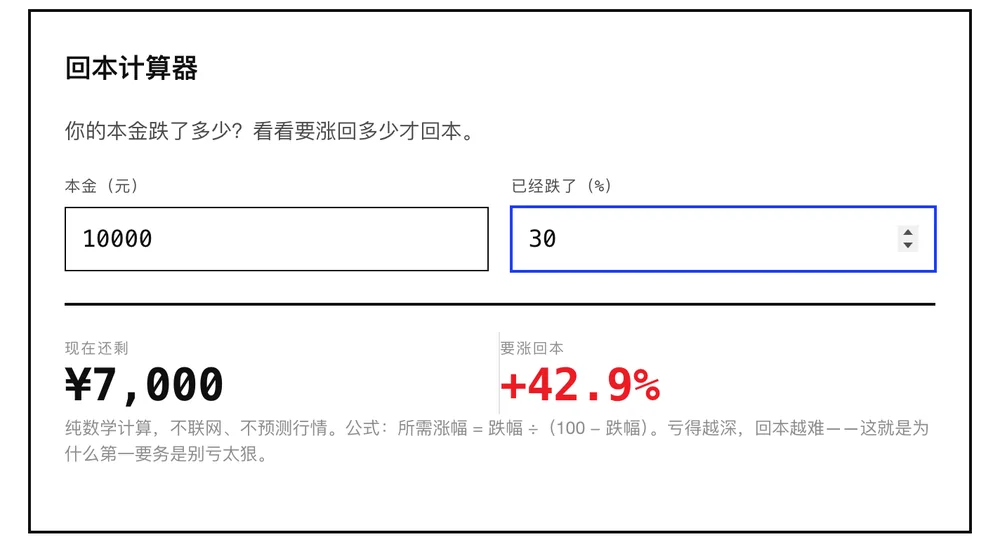
That is the actual interface of the recovery calculator in our risk tools: enter 10000 as the starting amount and a 30% drop, and it works out that 7,000 is left and that you need +42.9% to break even, with the formula it uses printed on the line below. The shot was taken on the Chinese version of the page; the English page runs the same calculator. The currency symbol is simply how the tool labels the field — read it as USDT and the conclusion is identical, because this is pure ratio arithmetic and has nothing to do with what you price in.
Put that set of numbers next to "trade your way back" and the problem shows itself. Someone deep underwater does not need a 5% or 10% bounce; they need 42.9%, or a double. Getting a move like that in a short window leaves a short list of tools: average down, rotate into something wilder, add leverage. Every one of them pushes exposure up, and you reach for them in the state where your judgement is at its worst. The first hole is the loss. The second is the one you dug to fill the first, and the second is usually deeper. The arithmetic behind all of this is worked through step by step in the math of losses and recovery: why a 50% drop needs a 100% gain.
So stopping is not conceding. It only refuses to let the first hole push you into the second. An account that stops at 8,000 and an account that stops at 5,000 need 25% and 100% respectively to get back — that is not "a bit more effort," it is two different difficulty levels.
How to restart next year
The first thing a restart involves is recalculating, not reopening. Say the year really did run down to the line and the capital went from 10,000 to 8,000. Next year's ceiling is 8,000 × 20% = 1,600 USDT, and 1% per trade is 80 USDT. Both numbers shrank along with the capital, as they should.
I know the thought that surfaces easily here: the capital is smaller, so if I keep using the old 2,000, will I not climb back faster? Convert it and you can see what it is: 2,000 ÷ 8,000 = 25%. You have quietly moved your annual risk from 20% to 25%. Raising the risk percentage after the capital shrinks is exactly the move this line exists to block.
If you hit the line two years running, I would suggest changing the question you ask. From 10,000 down to 8,000, another 20% is 6,400 — a cumulative loss of 36%, and getting back to where you started takes a 56.3% gain (10,000 ÷ 6,400 = 1.5625). At that point the question is not "which coin next year," it is "is this a good fit for me, or, more precisely, for the state I am in right now." The answer can be a smaller scale, it can be a slower approach, or it can be stepping away for a while — all three are serious answers. If you want to work out from scratch how much money to bring in at all, our piece your first buy: how much should you actually put in? starts from zero.
Risk note
This article shares personal experience and a method. It is not investment advice and it recommends no specific asset. Crypto prices are extremely volatile and losing all of your capital is possible. This annual loss limit is a practice the writer uses himself; it is not an industry standard and not any institution's requirement, and the 10,000 USDT, the 20% and the one month are illustrative parameters set out to explain the arithmetic, not a prediction of any gain or loss. Whether to set such a line, where to set it, and what to do after you hit it are yours to decide, and the consequences are yours alone.
A line only works if you can check it against a number
The limit for the year, the amount you put at risk per trade, and the gain it would take to climb back are all arithmetic you can do before you open anything at all. The calculators on this site run those numbers in the browser and say so on the page: pure math, no network, no price predictions. Work your own figures out first, then decide whether the line you were about to write down is one you can actually hold to.